Measure and Optimize Your Product-Market Fit Like a Superhuman
Product-Market Fit: The nebulous concept that means “your product is working”. That every business strives for. But what is it, exactly? You know it when you see it:
You can always feel when product/market fit isn’t happening. The customers aren’t quite getting value out of the product, word of mouth isn’t spreading, usage isn’t growing that fast, press reviews are kind of “blah”…
Marc Andreessen
And you can always feel product/market fit when it’s happening. The customers are buying the product just as fast as you can make it … You’re hiring sales and customer support staff as fast as you can.
Which leaves us with the questions: How do we reach Product-market fit (PMF)? How far are we away from PMF? Are we making any progress?
Rahul Vohra, Founder and CEO of Superhuman, shared an interesting concept for how to measure progress on your way to Product-market fit. He even described a process they are using at Superhuman for how to get step by step closer to Product-market fit.
What plays a huge role? Surveys.
With Vohra’s concept and one basic Crowdsignal survey, you can collect the data you need to optimize and analyse your PMF and come away with actionable tasks to improve your product.
- Understand Product-market Fit Optimization
- Build a survey and collect data
- Analyze
- Identify actionable tasks and prioritise
Understand Product-market Fit Optimization
Before you can optimize, you need to know where you came from and where you are. To make progress with something, you need to be able to measure — and almost anything can be measured. If you have a factor that helps you to reduce uncertainty and make better decisions, measure it. Be aware, a perfect indicator never exists, and for something that is hard to define like PMF it’s even harder to find one, but if it helps you to reduce uncertainty and helps you to visualize progress, you are better off.
For PMF, we’re looking for a leading indicator that helps us understand how consumers are responding to our products, how valuable and relevant it is to them. Something we can use to communicate progress to the team or other stakeholders.
A while ago Sean Ellis (the marketing exec (Dropbox, Eventbrite) who coined the term “growth hacking”) was looking for such an indicator and identified one, a “PMF score” if you will, with this simple multiple choice question:
“How would you feel if you could no longer use this product?”
– Very Disappointed
– Somewhat Disappointed
– Not Disappointed
After benchmarking with around a hundred startups, Ellis found that companies showed a level of growth that felt like PMF the moment about 40% of users answered “very disappointed.” Companies that struggled to find traction almost always had fewer than 40% of users respond “very disappointed”. Some others did similar experiments like and got similar results.
The precise percentage will obviously vary somewhat among products and markets, but 40% seems likeIt’s very hard to benchmark these numbers between different products and markets. Even simple differences in the process of measuring can already impact these numbers significantly.
Though it is not really important to know exactly where this point might be for your business, as long as the PMF score is an indicator at all, it can guide you making decisions. If you compare the numbers for your product over a couple of months, keeping the measuring process as constant as possible, this indicator can probably tell you if you made progress — or not.
Setting up a Product-market Fit Engine
Now we have a PMF score, but how do we increase it? Is there a methodology to systematically optimize your PMF score?
Superhuman developed their strategy based on three follow up questions to the PMF Score question:
“What type of people do you think would most benefit from XYZ?”
This points to something that people often forget: You not only can adjust your product, you also can change your market.
This question helps you to find out for whom the product is the best fit for. This is the audience you should double-down on — it’s where your most likely customers are.
Lots of people respond to this question with “me” and describe themselves, which is totally fine. The real value comes from the description of their market segment in their own words.
“What is the main benefit you receive from XYZ?”
This question gets at the “why?”: Why do people appreciate your product. This will help you segment your user base, and has the nifty side-effect of having your audience write marketing copy for you. Pay close attention to the words they use to describe your product, and try speaking your audience’s own language in your communications
“How can we improve XYZ for you?”
This question allows you to find out what holds users back from loving your product. What’s missing? What do we need to add to delight our customers?
Analyzing the responses to these follow-up questions will help you segment your user base, identify the people most likely to become delighted users, and also will give you some inspiration for reaching out to them.
But before you can analyze, you need responses. Let’s set up the survey with Crowdsignal.
Building the survey and collecting data
Let’s walk through the processes of creating the survey, getting it in front of your audience, and gathering the responses.
Setting up your survey
Step 1
Go to crowdsignal.com and sign up for an account (free is fine!).
Step 2

Create a new survey and choose the “Single Question per Page” mode — it’ll show respondents one question at a time, which is useful for this kind of survey.
Step 3
Add the four questions using the Multiple Choice and Free Text questions. Set the first question — which is key for determining your PMF score — as mandatory. Here are the questions and answers again — feel free to cut and paste:

Question 1 (Multiple choice):
“How would you feel if you could no longer use XYZ”
– Very disappointed
– Somewhat disappointed
– Not disappointed
Question 2 (Open text field – multi-line):
“What type of people do you think would most benefit from XYZ?”
Question 3 (Open text field – multi-line):
“What is the main benefit you receive from XYZ?”
Question 4 (Open text field – multi-line):
“How can we improve XYZ for you?”
Step 4

Now, let’s style the survey a little: Head to the “Styling” tab, where you can choose between some basic survey layouts for your survey, or customize it with your own CSS. (The Plain White theme is never a bad place to start.)
Here is how the survey could look like:
Sharing the survey
This is the moment to decide how to share your survey and who to share it with. It’s critical that you collect responses from people who’ve had the chance to use your product for a while.
The “Sharing” tab includes several options for getting your survey in front of people. For this survey, we recommend email. Email gives you much more control over who is answering your survey. You can define a cohort e.g. purchasers that all registered during a certain timeframe or are from a certain country, or people were referred to you by a specific marketing channel. This helps a lot to keep your data collection more consistent.
Collecting your data
The moment you share your survey, results can start coming in.
If you like you can choose to enable email notifications whenever a survey is completed.
To make it simpler to share and sort your results, connect your survey to a Google Sheet — you’ll be able to use all the sorting and filtering power of Google.

To set this up, go to the “Results” tab and choose “Connect.” In the pop-up window, choose “Connect Google Sheet.”
Authorize your account, and wait for a moment until the link to your Google Sheets file appears.
It’s almost time to analyze — once you have enough data. Superhuman worked with 100-200 responses, but small businesses can get valuable results with around 40 responses.
Analyze
To understand the analysis process, let’s use some dummy data from hypothetical service we’ll call: RentaBike.
1) Calculate your PMF Score
The RentaBike team reached out via email to 500 users that at least rented twice a bike in the last two month and got 50 responses.
Here are their PMF score results based on the first question:
– Very disappointed: 10 users (20%)
– Somewhat disappointed 14 users (28%)
– Not disappointed 26 users (52%)
PMF Score: 20%. This is RentaBike’s baseline.
Please note: In order to have a PMF score that is comparable to future iterations, you will need to collect these results in a consistent way. You’ll need to share the survey in the same way with a cohort of similar users and ask people after the same amount of product usage.
2) Narrow down the market
Your PMF score might be lower than you hoped, but there’s a step for improving it before you consider changing your product. Remember: Product-market Fit optimization is not only about iterating your product, but also about finding the right market. Can narrowing down their market optimize Rentabike’s PMF Score?
Let’s take a look at the answers to the first follow up question:
“What type of people do you think would most benefit from XYZ?”
Looking at all the answers will give us an overview of expected — and maybe some unexpected — user segments. RentaBike clusters their 50 respondents into a few market segments based on their answers:
- Students
- Tourists
- Climate Activists
- Athletes
Now let’s take a look at the most loyal customers (the very disappointed ones). What if RentaBike focused mainly on the market segments where their product already seems to resonate? If we limit the PMF analysis to only these people, does the PMF Score change?
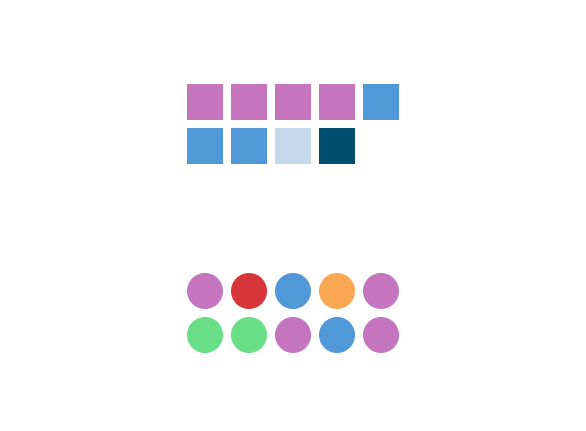
Let’s explore this visually. The shape of each element in the graphic represents the answers to the first question (PMF Score):
Squares are very disappointed, circles are somewhat disappointed, and triangles are not disappointed.
The patterns represent the four market segments.
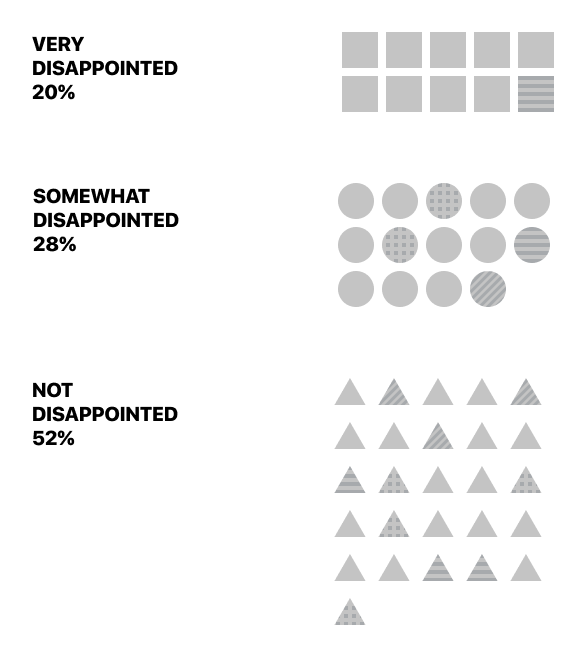
This makes it easy to see that the “very disappointed” group is made up of just two market segments: Tourists (solid fill) and Students (horizontal stripes).
Filtering by the Tourist segment seems like a good strategy for RentaBike. Let’s see if their PMF Score changes if we only look at Tourists:
The PMF score for this market goes up from 20% to 25.7%.
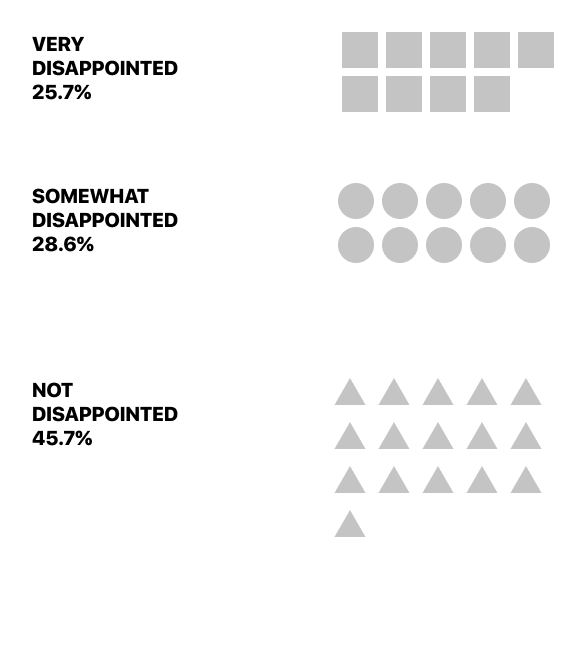
What does this tell us? It’s a hint that there’s a niche market where RentaBike could be more competitive. By tailoring the communications and product features set to the Tourist market, RentaBike can increase its marketing efficiency and, ideally, grow revenue.
Is this market big enough for the product to grow in this stage of the company? That’s another question. For an early startup narrowing down the market is in most cases a good strategy.
3) Segment loyal Customers and identify your product’s core benefits
With its adapted market definition — Tourists — RentaBike can analyze it’s existing core user-base, users are already pretty happy with the product. Let’s take the “Very disappointed” group and look at their answers for Question 2:
“What is the main benefit you receive from XYZ?”
RentaBike summarizes and clusters these answers to identify main topics and trends, which are:
“Great looking bikes”
“Easy account onboarding”
“Fair pricing”
“Rent stations easy accessible downtown”
These are the benefits that are valuable to their loyal users. Can they attract new customers with similar needs?
4) Segment Users with the most likelihood of becoming loyal customers
To grow its group of loyal customers, RentaBike needs to find the people most likely to convert. The “somewhat disappointed” group is a great stand-in, but it’s still a group with a broad set of needs.
Segmenting this group further could identify users that might be a great natural fit to the core user base. As they did in the last step, RentaBike identifies the things that this user group appreciates in the product and looks at the differences between the “very disappointed” and “somewhat disappointed” customers.
Trying to visualize this again: The shapes represent the “very” (squares) and “somewhat” disappointed (circles) groups, and the colors are the four benefits people identified:
The RentABike benefits most often mentioned by loyal customers are “Great looking bikes” (purple) and “Easy account onboarding” (blue).
It turns out the “Somewhat disappointed” group also has customers who mention these benefits (the purple and blue circles).
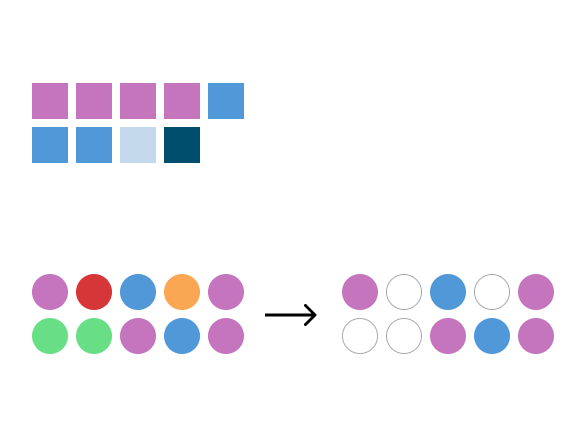
These are people that already appreciate some of the benefits of the product for the same reasons that the loyal customer group does. They seem to be the next best segment to target.
This is the point to get excited and worth all the work we did so far: We finally know whom to address next.
These people are not yet fully delighted, which brings us to the last step.
5) Identify what’s holding them back
Time to look at this group’s answers to Question 4:
“How can we improve XYZ for you?”
Are some issues mentioned several times? Can you address some of these things in your product? RentABike’s most mentioned answers are:
“Bikes for kids”
“Payment without credit card”
“More flexible bike drop off”
“Full day rate, not only pricing per-minute”
These suggestions are Rentabike’s best shot to convert this user group to loyal customers.
Identify actionable tasks and prioritise
Not every issue can be solved or is worth solving, so now it’s up to the business to prioritize its next steps.
For RentaBike things like “Bikes for kids” or “More flexible bike drop off” might be too resource-intensive or logistically difficult, while “Payment without credit card” or “Full day rate” are changes that are fairly easy to implement and can have a significant impact. RentaBike might also decide to shift their marketing budget to advertise more in tourist-focused publications. Whatever your criteria are for roadmap prioritization, make your list and then get started iterating on your product, your communications, and your market segments.
What happens when you finish making these changes? Time for another round of PMF analysis. Time to reach out again to a new cohort of users. Try to keep the process of collecting your data as similar as possible to your previous round. Keep the same channel for reaching out to users and address users with the same level of product experience. Your new PMF Score will give you feedback on your progress, and you can start again analysing your data and segmenting your customers.
Round by round you should get closer to finally find this nebulous place of “your product is working”.