Your Survey Stats at a Glance
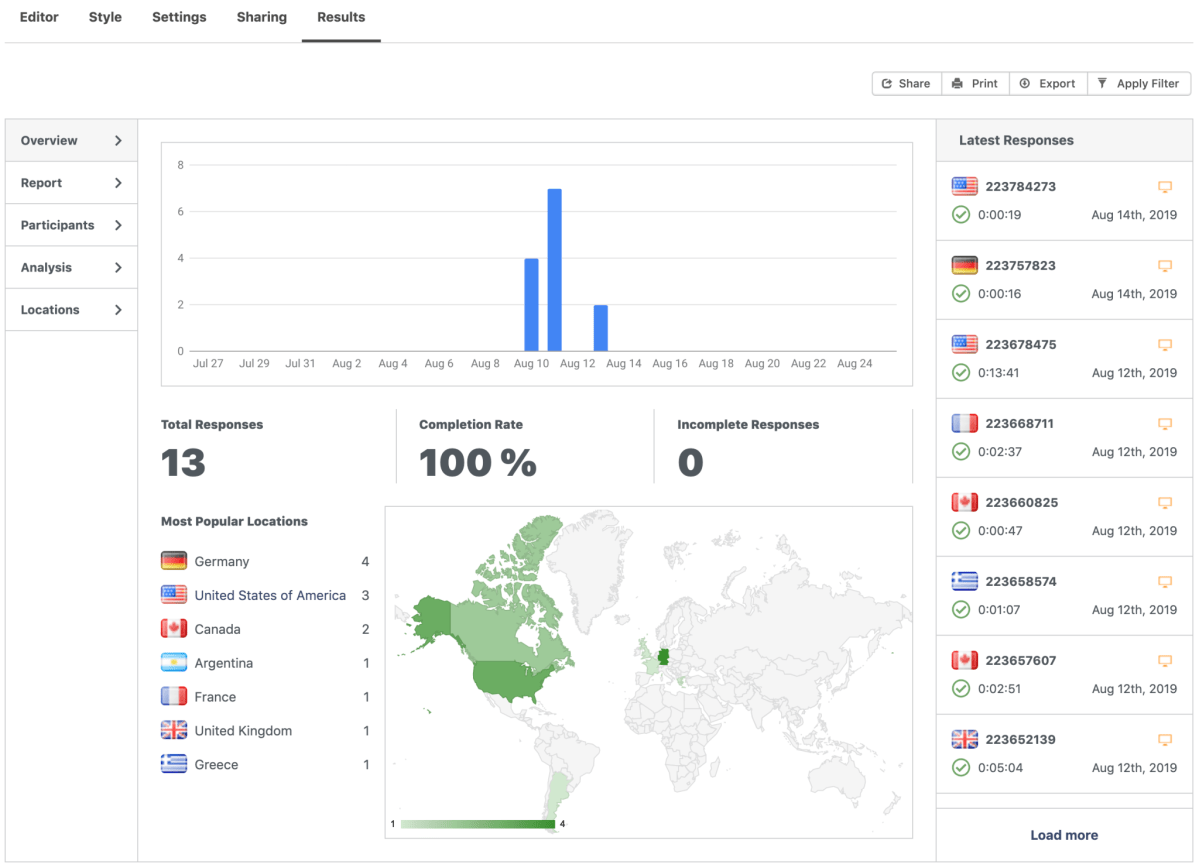
We’re pleased to announce today an improvement to your Survey stats with the addition of a new overview page that makes it super-simple to see how your survey has been performing. Here’s how the new page looks:

At the top you’ll find a chart of how many responses you’ve received over the past 30 days, and next to it some detailed information about the latest responses. At the bottom you’ll find the location chart that breaks down the responses by country.
All of the existing reports are still there in the new navigation area at the left side, including “Participants”, “Locations”, etc.
If you’re using the Free plan, did you know that our paid plans offer much more data in the Results area? Upgrade today to learn more from your audience!
We hope you enjoy this new feature! Please don’t hesitate to leave us any feedback you have here on this post!
Thanks,
The Crowdsignal Team